Problem
Most people talk about market stress as if losses scale smoothly with the size of the initial shock. In leveraged systems, that assumption can fail. Once enough portfolios cross their margin thresholds, forced selling can create a second wave of losses that is larger than the first.
Model logic
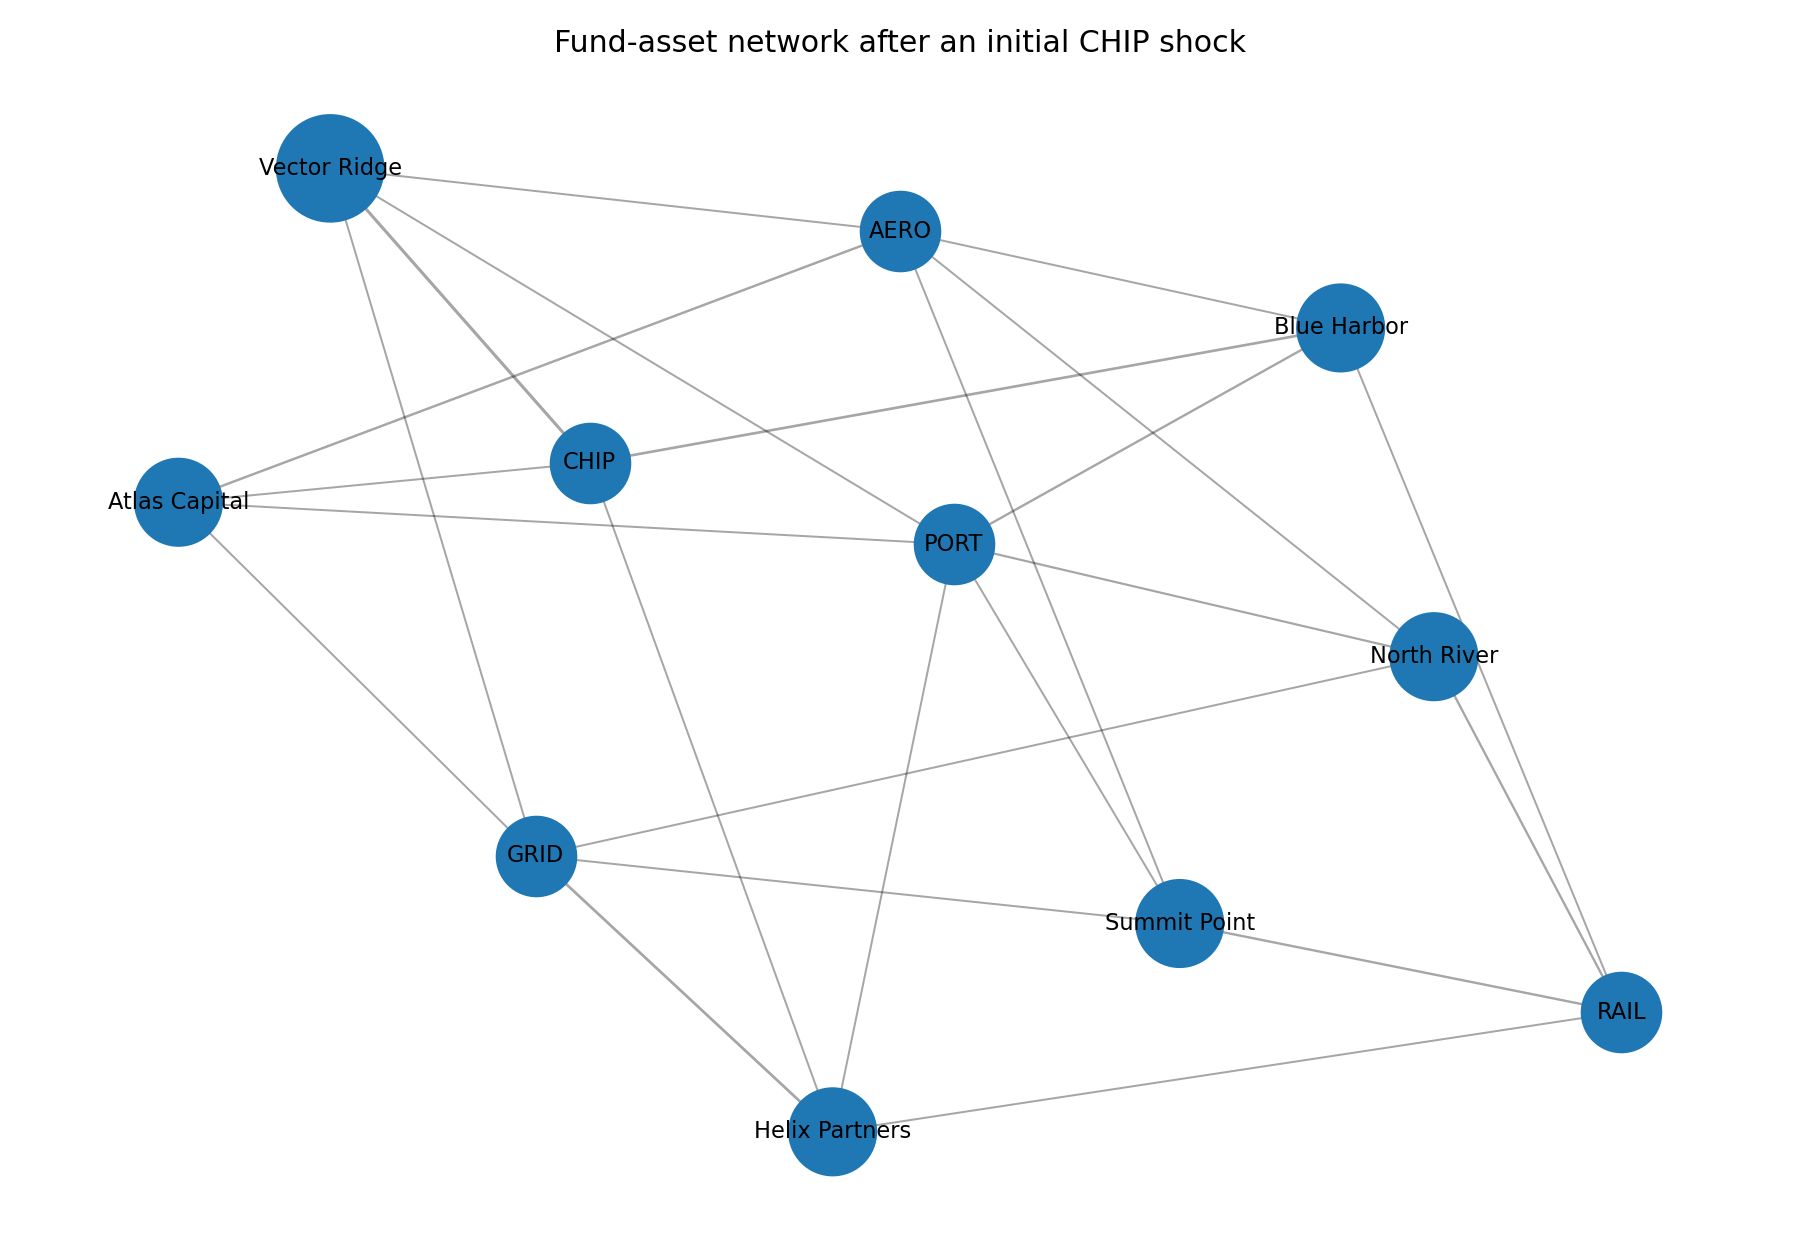
Each fund has equity, leverage, a margin threshold, a liquidation rule, and overlapping exposures to a shared set of assets. After an initial shock hits CHIP, the engine revalues portfolios, checks for breaches, forces distressed funds to sell, applies price impact, and repeats until the system stabilizes.
What the outputs show
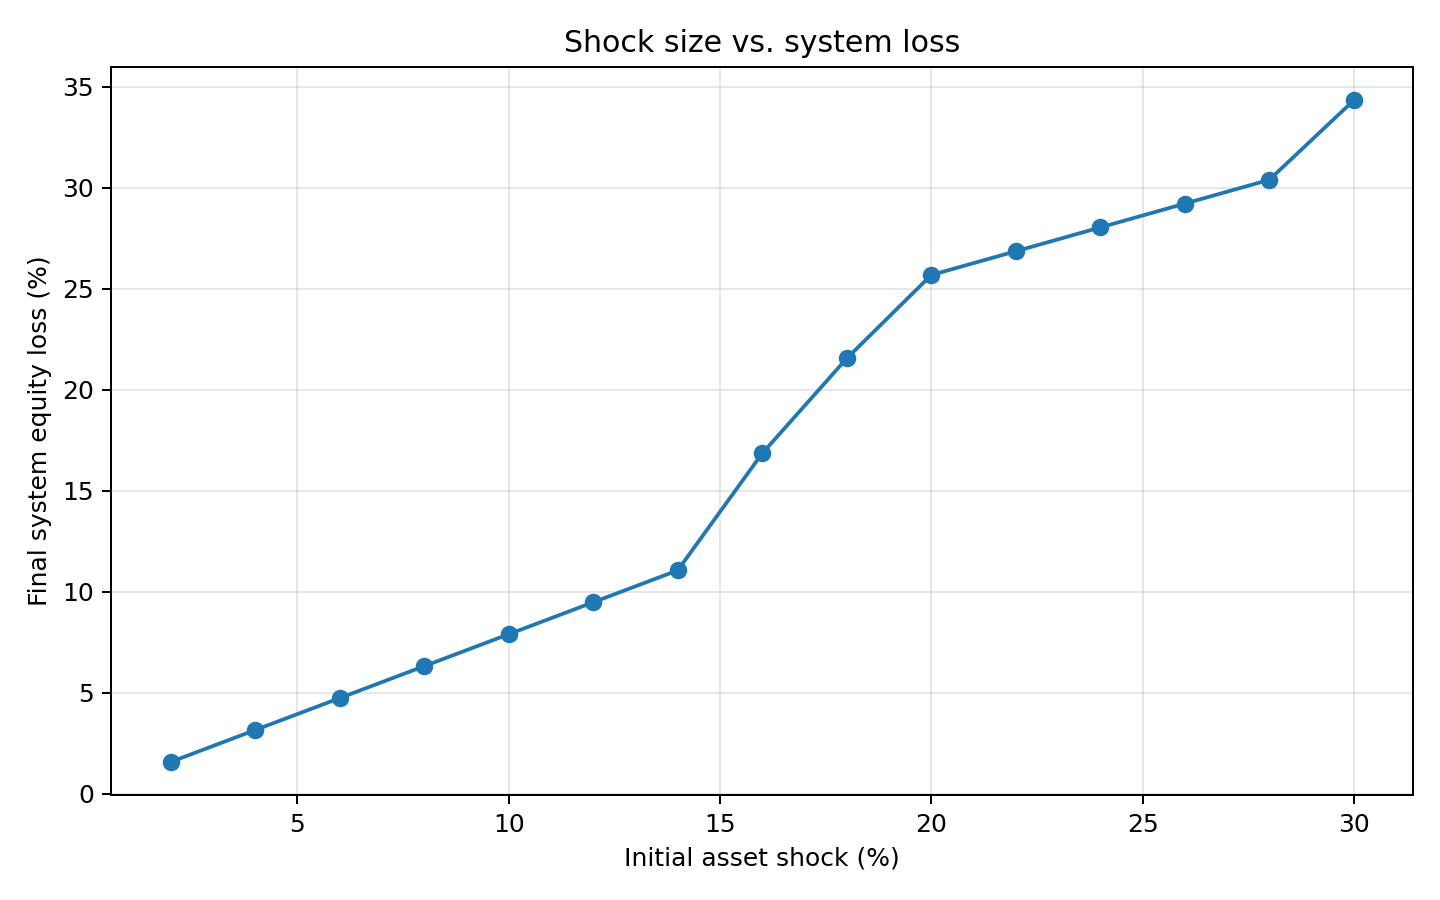
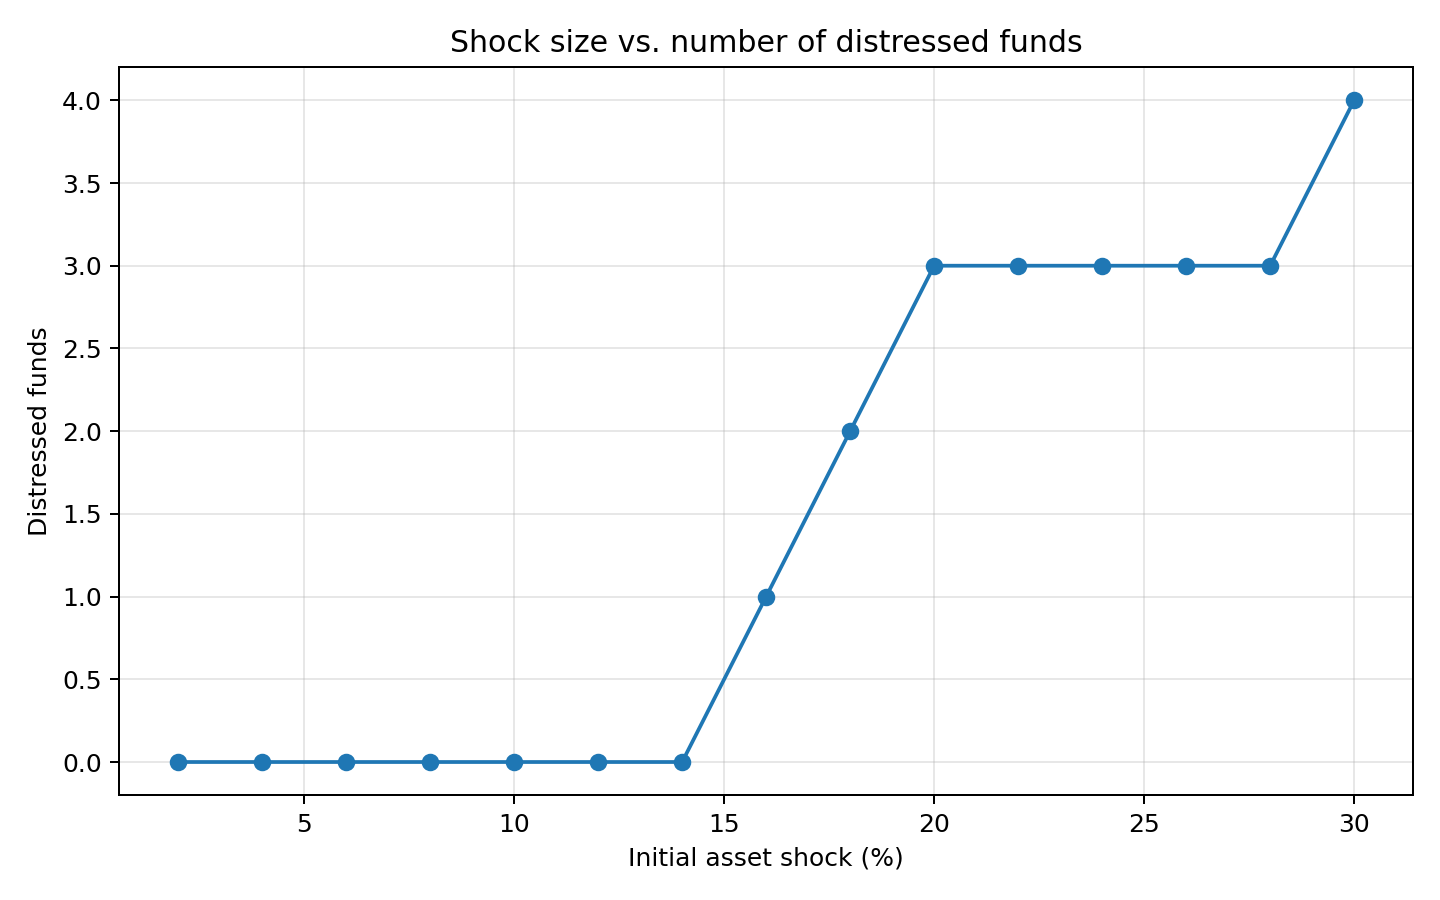
The system looks stable under smaller shocks. Then the shape changes. At 16%, the first distressed fund appears. At 18%, there are two. At 20%, there are three. System loss rises from 11.1% at a 14% shock to 16.9% at 16%, 21.6% at 18%, and 25.7% at 20%. The exact numbers are not the point. The visible nonlinearity is.
Why this project matters
- I can turn an abstract systems idea into a working model.
- I think in terms of thresholds, propagation, and feedback loops.
- I care about how systems fail under pressure, not just how they look in calm conditions.
What it is not
This is intentionally simplified. It is not a production risk engine, a forecasting product, or a claim about real institutions. Its value is that it makes a clear systems argument visible in code, charts, and interpretable outputs.